
Paper currently in review for publication in the Journal of Physics: Condensed Matter, Special Issue on Phase Transitions in Condensed Matter at Extreme Conditions.
Anirudh Hari1, Rohit Hari1*, Patrick G. Heighway2, Raymond F. Smith3, Thomas S. Duffy4, Melissa Sims1, Saransh Singh3, Dayne E. Fratanduono3, Cynthia A. Bolme5, Arianna E. Gleason5,6, Federica Coppari3, Hae Ja Lee6, Eduardo Granados6, Philip Heimann6, Jon H. Eggert3, June K. Wicks1a
1Department of Earth and Planetary Sciences, Johns Hopkins University, Baltimore, Maryland 21218, USA.
2Department of Physics, Clarendon Laboratory, University of Oxford, Parks Road, Oxford OX1 3PU, UK.
3Lawrence Livermore National Laboratory, 7000 East Avenue, Livermore, California 94550, USA.
4Department of Geosciences, Princeton University, Princeton, NJ 08544, USA.
5Los Alamos National Laboratory, Los Alamos, New Mexico 87545, USA.
6SLAC National Accelerator Laboratory, Menlo Park, California 94025, USA.
aAuthor to whom correspondence should be addressed: [email protected].
*Anirudh Hari and Rohit Hari contributed equally to this work.
Abstract: Alumina (Al2O3) is an important ceramic material notable for its compressive strength and hardness. It represents one of the major oxide components of the Earth’s mantle. Static compression experiments have reported evidence for phase transformations from the trigonal α-corundum phase to the orthorhombic Rh2O3(II)-type structure at ~90 GPa, and then to the post-perovskite structure at ~130 GPa, but these phases have yet to be directly observed under shock compression. In this work, we describe laser-driven shock compression experiments on polycrystalline alumina conducted at the Matter in Extreme Conditions endstation of the Linac Coherent Light Source. Ultrafast X-ray pulses (50 fs, 1012 photons/pulse) were used to probe the atomic-level response at different times during shock propagation and subsequent pressure release. At 107±8 GPa on the Hugoniot, we observe diffraction peaks that match the orthorhombic Rh2O3(II) phase with a density of 5.16±0.03 g/cm3. Upon unloading, the material transforms back to the α-corundum structure. Upon release to ambient pressure, densities are lower than predicted assuming isentropic release, indicating additional lattice expansion due to plastic work heating. Using temperature values calculated from density measurements, we provide an estimate of alumina’s strength on release from shock compression.
1. Introduction
Alumina (α-Al2O3) is a model material in ceramics and an important oxide component of the Earth. Due to its hardness and high compressive strength, it has a wide variety of industrial uses including in abrasives, insulators, windows and spark plugs (Doremus, 2008, pp. 1-26). In static high-pressure experiments using diamond anvil cells, Cr3+ fluorescence from the Al2O3 variety ruby has long been used as a pressure calibrant (Mao et al, 1978, pp. 3276-3283).
Al2O3 constitutes up to 6% of the Earth’s lower mantle by weight, and is expected to be almost entirely incorporated in the perovskite and post-perovskite phases of MgSiO3. (Irifune, 1994, pp.131-133) Alumina’s crystal structure under high pressures and temperatures is of interest due to its potential effects on the thermodynamics of phase transformations in MgSiO3 under lower mantle conditions, particularly near the core-mantle boundary (136 GPa) (Tsuchiya, Tsuchiya and Wentzcovitch, 2005, p.020103).
Static compression studies have probed the structure of alumina using powder X-ray diffraction (XRD), and identified a phase transformation from the trigonal α-corundum phase (space group R-3c) to an orthorhombic phase. This transformation was first reported by Funamori & Jeanloz (1997, pp.1109-1111) in polycrystalline ruby at a pressure of 100±10 GPa and ~1000 K. The phase transformation was later characterized in more detail by Lin et al (2004, pp.389-393), who found the transition to occur on compression to 109 GPa at 300 K, and to 96 GPa at ~1000 K. The new phase persisted down to 85 GPa upon decompression. Rietveld full-profile analysis showed that the diffraction peak shapes matched the Rh2O3(II)-type structure (Pbcn) rather than a perovskite structure (Pbnm). These findings are consistent with computational studies, which have found that the Rh2O3(II) phase becomes energetically favorable at pressures similar to those reported by Lin et al (2004, pp.389-393), as shown in Fig. 1. The perovskite phase is not expected to be stable in any pressure range at ambient temperature, but has been hypothesized to have a stability field around 100 GPa at temperatures above 2400 K (Oganov & Ono, 2005, pp.10828-10831). Static and computational studies have also found a second phase transition to the orthorhombic post-perovskite phase (Cmcm) at ~130 GPa (Tsuchiya, Tsuchiya and Wentzcovitch, 2005, p.020103; Oganov and Ono, 2005, pp.10828-10831). The α-corundum phase may be metastable up to pressures above both these phase boundaries; one static experiment found ruby to remain as α-corundum up to 175 GPa at room temperature (Jephcoat et al, 1988, pp.115-121).

Fig. 1: High-pressure phase diagram of Al2O3. The stability of the Rh2O3(II) phase was observed by Lin et al, (2004, pp.389-393) in static compression experiments on both compression (red triangles) and decompression (blue triangles), demonstrating agreement with theoretical phase boundaries computed by Tsuchiya, Tsuchiya and Wentzcovitch (2005, p.020103). Black circles represent α-corundum observed by Lin et al, (2004, pp.389-393). The calculated shock Hugoniot curve from SESAME EOS #7410 (single phase EOS) is shown in green (Lyon and Johnson, 1992). The melting curve was measured by Shen and Lazor (1995, pp.17699-17713) under static compression.
Shock compression is another technique used to study the behavior of materials at extreme pressures and temperatures. Mashimo et al (2000, pp.2021-2024) studied a-cut sapphire (single crystal Al2O3) under shock compression with a light gas gun using the inclined mirror method and reported a -3% volume discontinuity at 79 GPa and 1130 K on the shock Hugoniot. While this is suggestive of a volume collapse due to a phase transition, the crystal structure was not measured directly. Later experiments performed on c-cut sapphire by Reinhart, Chhabildas and Vogler (2006, pp.655-669) using a two-stage gas gun found no evidence of a phase transition up to 170 GPa in shock velocity – particle velocity measurements. The difference in results when compressing along different orientations of a single crystal raises the question of how a polycrystalline sample with no preferred orientation might respond under shock compression.
Recent developments in laser compression paired with in situ X-ray diffraction (XRD) now allow us to probe crystal structure directly during shock propagation (Duffy and Smith, 2019, p.23; Glenzer et al, 2016, p.092001). This has become an important method to study phase diagrams at much higher pressures than can be obtained with static methods (Wicks et al, 2018, p.5864; Lazicki et al, 2021, pp.532-535). However, it remains an open question whether phase transformations observed under static conditions are always accessible under the short timescales of shock compression (Langenhorst and Deutsch, 2021, pp.31-36; Pavlovskii and Drakin, 1966, p.116). Comparing results between static and dynamic experiments at similar pressures can help characterize kinetics, thermodynamics, and mechanisms of structural transitions in materials (McBride et al., 2019, pp.89-94).
In situ XRD also provides new ways to constrain material strength at high pressures. This has been achieved by determining the amount of anisotropic elastic strain, i.e., difference in elastic strain between the loading and transverse directions. (Turneaure and Gupta, 2011, p.123510) Another way to infer material strength is by obtaining information about the path taken upon pressure release from shock. In particular, excess temperature during release relative to the expected rate of thermoelastic cooling is indicative of plastic-work heating, which directly results from dynamic strength (Heighway et al, 2019, p.245501). Determining whether a material maintains or loses its strength during unloading is of key interest in understanding its deformation.
The strength of alumina is of broad interest due to its widespread applications. Notably, polycrystalline alumina has been found to undergo an increase in and retention of high dynamic strength (~20 GPa) under shock to up to 100 GPa, unlike single-crystal sapphire which undergoes a loss of strength at lower pressures (Kleiser, Chhabildas and Reinhart, 2011, pp.473-479; Ahrens, Gust and Royce, 1968, pp.4610-4616). Measurements of alumina’s strength can also inform predictions of strength for other sesquioxides including Fe2O3, Rh2O3 and Cr2O3, which adopt the α-corundum structure at ambient conditions (Lin et al, 2004, pp.389-393).
In this study, we report measurements of alumina’s crystal structure during shock compression, reaching up to 107±8 GPa on the Hugoniot. Our study provides the first direct observation of a high-pressure phase transition in shock-compressed alumina. Using the density of alumina upon full release to ambient pressure, we estimate the plastic work heating and the corresponding strength of alumina under dynamic unloading. These results can serve as a reference for the behavior of other ceramic materials and understanding the physics of material deformation at nanosecond time scales.
2. Experimental Methods
Samples of 99.6% pure polycrystalline alumina with no porosity and no preferred orientation were purchased from Valley Design Corp. X-ray diffraction patterns taken prior to compression confirm the sample identity and purity.
Laser-driven shock compression experiments were performed at the Matter in Extreme Conditions endstation of the Linac Coherent Light Source (LCLS). LCLS is an X-ray Free Electron Laser (XFEL) that delivers coherent, vertically polarized, ~50 fs X-ray pulses, with ~1012 photons/pulse. Each target package consisted of a 50-µm thick polyimide ablator layer, a 0.2-µm aluminum or 1-µm gold reflective coating, and 60 µm of polycrystalline alumina (Fig. 2a). The target was shock compressed by focusing a 10-13 ns near flat top drive laser pulse, delivered by either one or two beams of a 527-nm Nd-YAG glass laser, onto the polyimide ablator surface. Waveplates were tuned between 45-53º to create a focal spot size of ~250 µm on the ablator surface and reach the desired sample stress state (Brown et al, 2017, p.105113). Two time series of five shots each were conducted on alumina at nominal pressures of ~50 and ~110 GPa using one or two overlapping drive beams, respectively. Targets with a gold reflective coating were used for the single-beam shots (runs 199 to 209), while those with an aluminum coating were used for the dual-beam shots (runs 252 to 273). The X-ray beam’s spot diameter was ~20 µm in the single-beam shots and ~80 µm in the dual-beam shots. VISAR velocimetry data were collected, but almost no signal was observed with this target setup due to the opacity of the sample.

Fig. 2: Target setup and CSPAD detectors. (A) Schematic of the experimental setup (not to scale). One or two beams of the 527-nm Nd:Glass laser were focused onto a ~250-µm spot on the ablator surface. Targets used for the single-beam shots had a gold reflective coating, while those used for the dual-beam shots had an aluminum coating. A 50-fs pulse of the LCLS XFEL was directed onto the sample at a 24° angle of incidence and focused to a spot size of 20 or 80 µm. Scattered x-rays were detected on large area Cornell-SLAC Hybrid Pixel Array Detectors (CSPAD) (Herrmann et al., 2013, pp.550-553) (B) Cartesian projection using the HEXRD analysis software showing the positions of the CSPADs and the angular range of data collection. The diffraction pattern shown was collected in run 255.
The crystal structure of alumina was probed during shock and release using coherent, vertically polarized, 8.02 keV, ~50 fs X-ray pulses produced by the XFEL. The X-ray beam entered the target package at a 24º angle of incidence. Runs 232 and earlier used an X-ray spot diameter of 20 µm, while in runs 233 and later it was 80 µm. X-ray diffraction (XRD) patterns were recorded by five Cornell-SLAC Pixel Array Detectors (CSPAD) with 16-71º angular 2θ coverage (Fig. 2b). X-ray delays with respect to the drive laser ranged from 7 to 20 ns, probing the sample at various times relative to shock propagation and release. Detector positions and orientations were determined using diffraction patterns from a CeO2 calibrant, and cross-validated with diffraction from the uncompressed Al2O3 starting material.
The HEXRD analysis software was used to convert XRD patterns to polar coordinates and perform Lorentz-polarization and pixel solid angle corrections on the data (Boyce and Bernier, 2013).
Azimuthally averaged diffraction patterns were fit to a pseudo-Voigt peak shape using the Pawley method with the powder diffraction tool in Fityk (Wojdyr, 2010). This fitting was used to determine lattice parameters and density during and after shock.
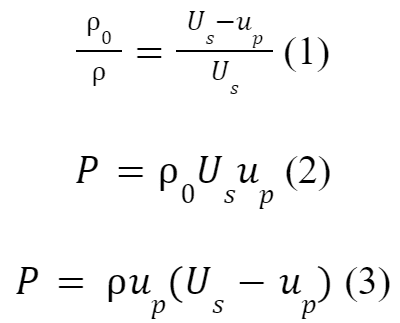
Pressure was determined using the linear Us-up (shock velocity – particle velocity) relation of Al2O3 experimentally determined in several studies up to 300 GPa (Ahrens, Gust and Royce, 1968, pp.4610-4616; Barker and Hollenbach, 1970, pp.4208-4226; Erskine, 1993; Graham and Brooks, 1971, pp.2311-2330; Kleiser, Chhabildas and Reinhart, 2011, pp.473-479; Mashimo, Hanaoka and Nagayama, 1988, pp.327-336; Marsh, 1980; Reinhart, Chhabildas and Vogler, 2006, pp.655-669). These, together with the following Rankine-Hugoniot equations for conservation of mass (Eqn. 1) and momentum (Eqn. 2), were used to calculate pressure from the densities measured during shock, via Eqn. 3.
Most of the previous Hugoniot studies were conducted on single-crystal sapphire. Given the large strength of Al2O3, the Hugoniot curve could differ between the single crystal and polycrystalline forms. Mashimo, Hanaoka and Nagayama (1988, pp.327-336) and Ahrens, Gust and Royce (1968, pp. 4610-4616) measured the Hugoniot of both single crystal and polycrystalline Al2O3, and determined that while there is a difference in the Hugoniot Elastic Limit, the deformational Hugoniot curve is nearly identical for non-porous samples, such as used here.
The HYADES hydrocode was used to perform 1-dimensional simulations of shock propagation and release for all shots (Larsen and Lane, 1994, pp.179-186). The kapton ablator was modeled using the SESAME #7770 equation of state (EOS) table for parylene, while alumina was modeled using SESAME EOS #7410. The known relative laser power as a function of time for each shot, shown in Fig. S3 in the Supplementary Materials, was applied to the kapton surface, yielding pressures of ~50 GPa or ~110 GPa in alumina. Example simulations of runs 269 and 205 are shown in Fig. 4.
3. Results
We measured two time series of X-ray images, revealing the changes in crystal structure of polycrystalline alumina through shock compression and subsequent pressure release (see Table 2 and Fig. 3). Targets were shocked to a nominal pressure of ~50 GPa or ~110 GPa using one or two beams of the MEC drive laser focused onto a ~250-µm spot on the kapton ablator, and X-ray images were collected at different times relative to the drive laser pulse (defined as t=0). Diffraction from ambient Al2O3 was observed in many of the images, and several include diffraction from both shocked and decompressed material. Timings of partial release from the kapton-alumina interface were deduced from drops in density observed in the compressed material over time. The timings of shock breakout from the free surface of alumina were, in the single-beam shots, determined based on presence of diffraction peaks from the unshocked starting material, which disappear once the shock wave reaches the free surface (Table 2).
In the single-beam shots (shocked to ~50 GPa), alumina remained in the α-corundum phase both on shock and release, with no apparent change in texture (Fig. 3a and Fig. S1a). These targets included a gold reflective coating whose diffraction is also observed during compression. The c/a ratio of alumina was observed to be 2.72-2.74 for all shots in this sequence (compression and release) except at 10 ns where a value of 2.69 was observed. Release from the shocked state begins between 16 and 18 ns, evidenced by a sharp increase in d-spacing between these X-ray images. At 20 ns, the latest time sampled, the material remains partially compressed. At the earlier times of 10 and 14 ns, a spotty diffraction signal with two-theta values intermediate between those of the ambient and fully compressed states is observed. This could arise from elastically compressed material, but future work is needed to better understand these observations.
In the dual-beam shots, alumina was shocked to ~110 GPa. Diffraction at 9 ns (run 269) does not include any peaks that could be indexed to the shocked α-corundum phase. We instead observe evidence for a new phase that shows a change in the azimuthal intensity distribution around the Debye-Scherrer cones. The diffraction patterns match both the Rh2O3(II) phase and the perovskite phase with a density of 5.16±0.03 g/cm3 for each (see Fig. 3c). We assign the Rh2O3(II) phase based primarily on previous static and theoretical results. Peak fitting with the Pawley method yields a better fit with lower reduced χ2 for the Rh2O3(II) phase, but due to the presence of overlapping peaks, it is difficult to draw concrete conclusions about the goodness of fit (see Table 1, Table S2 and Fig. S4). We also observe three additional peaks that match the Rh2O3(II) phase at a density of 4.80±0.01 g/cm3 on decompression, indicated in Fig. 3c with red circles. These appear as spots rather than lines, suggesting further development of preferred orientation as the sample begins to unload.
In diffraction patterns taken at later times of 10 and 11 ns (runs 252 and 270), peaks consistent with the α-corundum phase are observed and the corresponding densities are 4.36±0.04 g/cm3 and 4.35±0.01 g/cm3, consistent with back-transformation on release from the shocked state. Similar to the 9-ns timing, these diffraction lines exhibit a change in texture relative to the starting material, suggesting a transition to the new phase and back to ɑ-corundum. By 13 ns (run 273), the material has fully returned to ambient pressure and displays a uniform texture, suggesting a loss of texture with release which may be due to fracturing and break-up of grains on decompression, creating a more uniform powder.
For the dual-beam shots, the X-ray spot size was increased from 20 µm to 80 µm in order to increase the number of grains sampled by the X-ray beam and smooth out the texture of the polycrystalline sample. As the laser spot size remained at ~250 µm, the larger sampled region likely resulted in diffraction signal from laterally released material from the edges of the shocked region. We attribute diffraction from material whose densities are considerably lower than that of the starting material to this laterally released material. The wider X-ray focus also resulted in diffraction from ambient, starting material outside the shocked region, including after shock breakout.
| Structure | a (Å) | b (Å) | c (Å) | ⍴ (g/cm3) | Reduced χ2 | R2 |
| Rh2O3(II) (Pbcn) | 6.457±0.004 | 4.448±0.006 | 4.564±0.001 | 5.16±0.01 | 0.702 | 0.9961 |
| Perovskite (Pbnm) | 6.422±0.003 | 4.545±0.001 | 4.499±0.020 | 5.16±0.03 | 2.709 | 0.9782 |
Table 1: Comparison of Pawley fits to the Rh2O3(II) and perovskite structures in the shocked phase of run 269 (9 ns X-ray delay). Both structures are good fits to the observed diffraction peaks, but Rh2O3(II) has a lower reduced χ2 and higher R2. Since our data include some overlapping peaks with unclear distinctions, and we refine three independent cell parameters, our error bars likely underestimate the true uncertainty in lattice parameters and density.
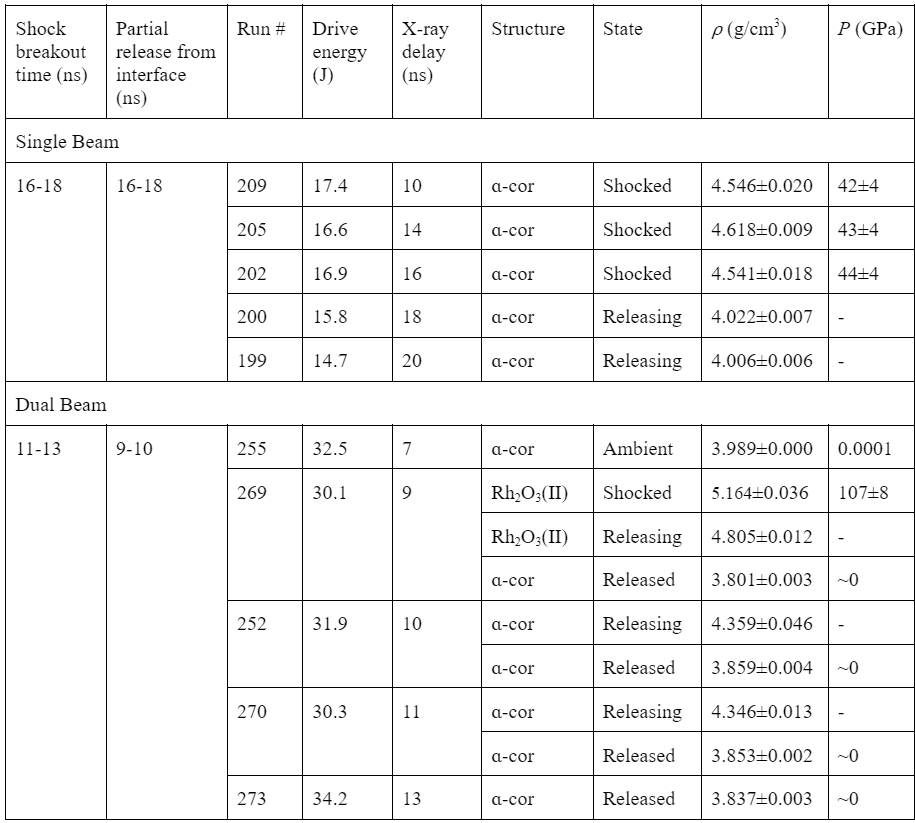
Table 2: Summary of X-ray diffraction data. Some runs include diffraction from multiple phases. In run 269, which includes the new phase, the densities and pressures shown assume the material is in the Rh2O3(II) phase. Diffraction from the starting material is observed in several runs but is not included in this table, with the exception of run 255, in which it is the only phase present. In the single-beam shots, the timing of shock breakout from the rear free surface of alumina was determined based on the presence or absence of diffraction peaks from unshocked starting material at different X-ray timings. In the dual-beam shots, shock breakout time was determined from observation of only released material at 13 ns. Timings of partial pressure release from the kapton-alumina interface were estimated based on sharp drops in densities over time.
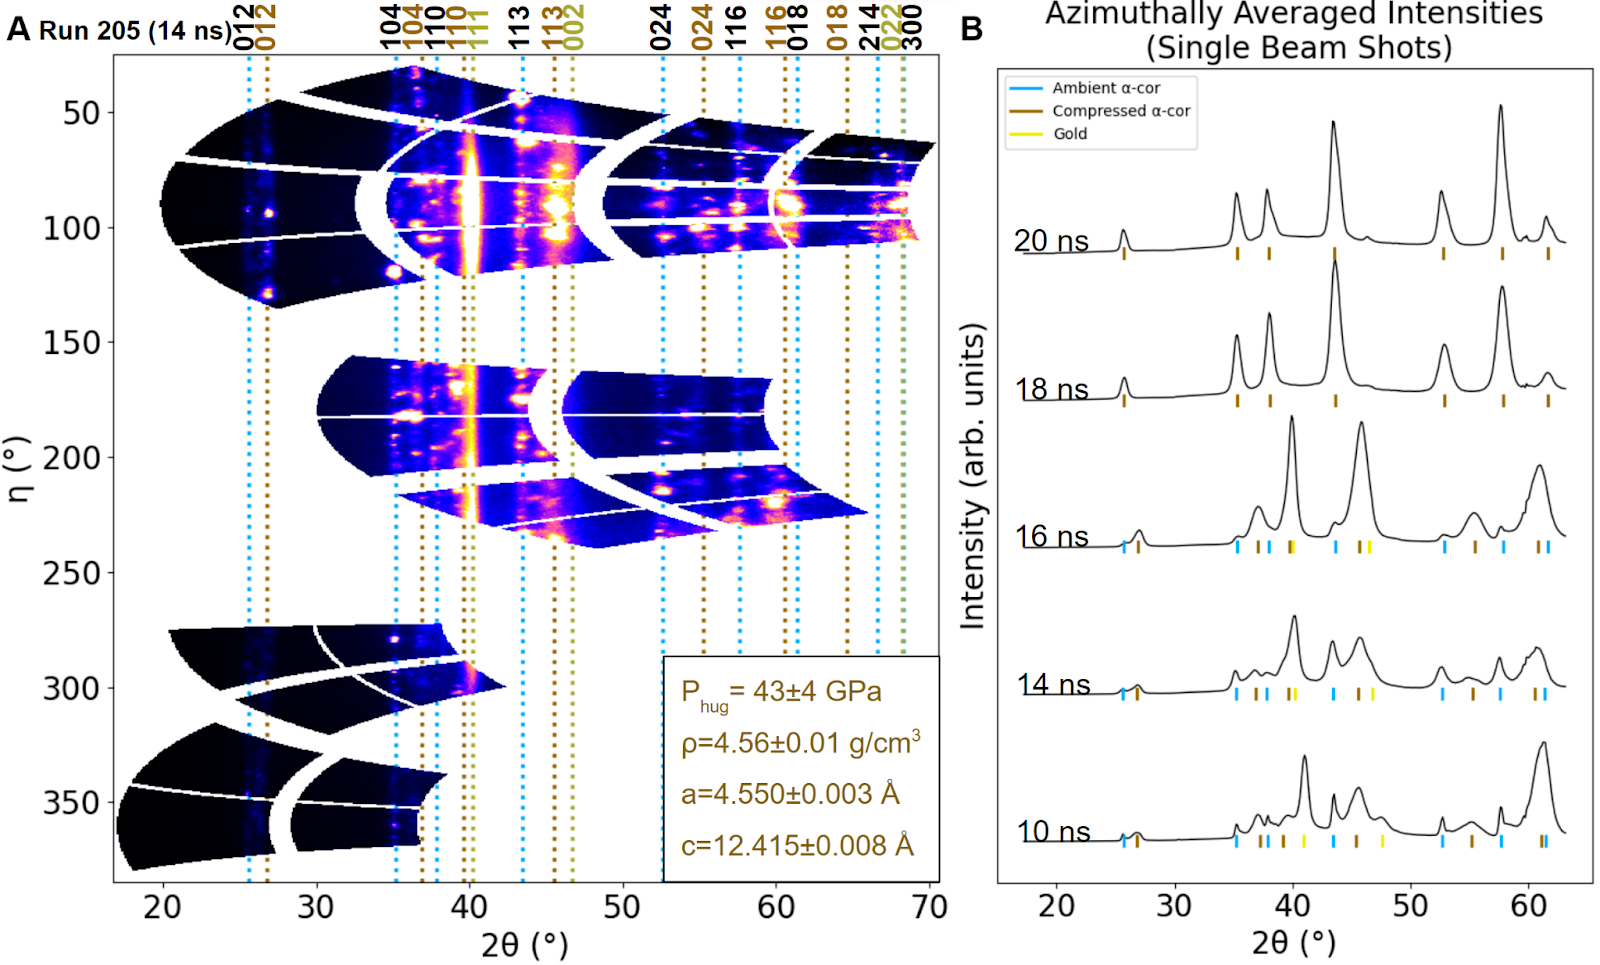
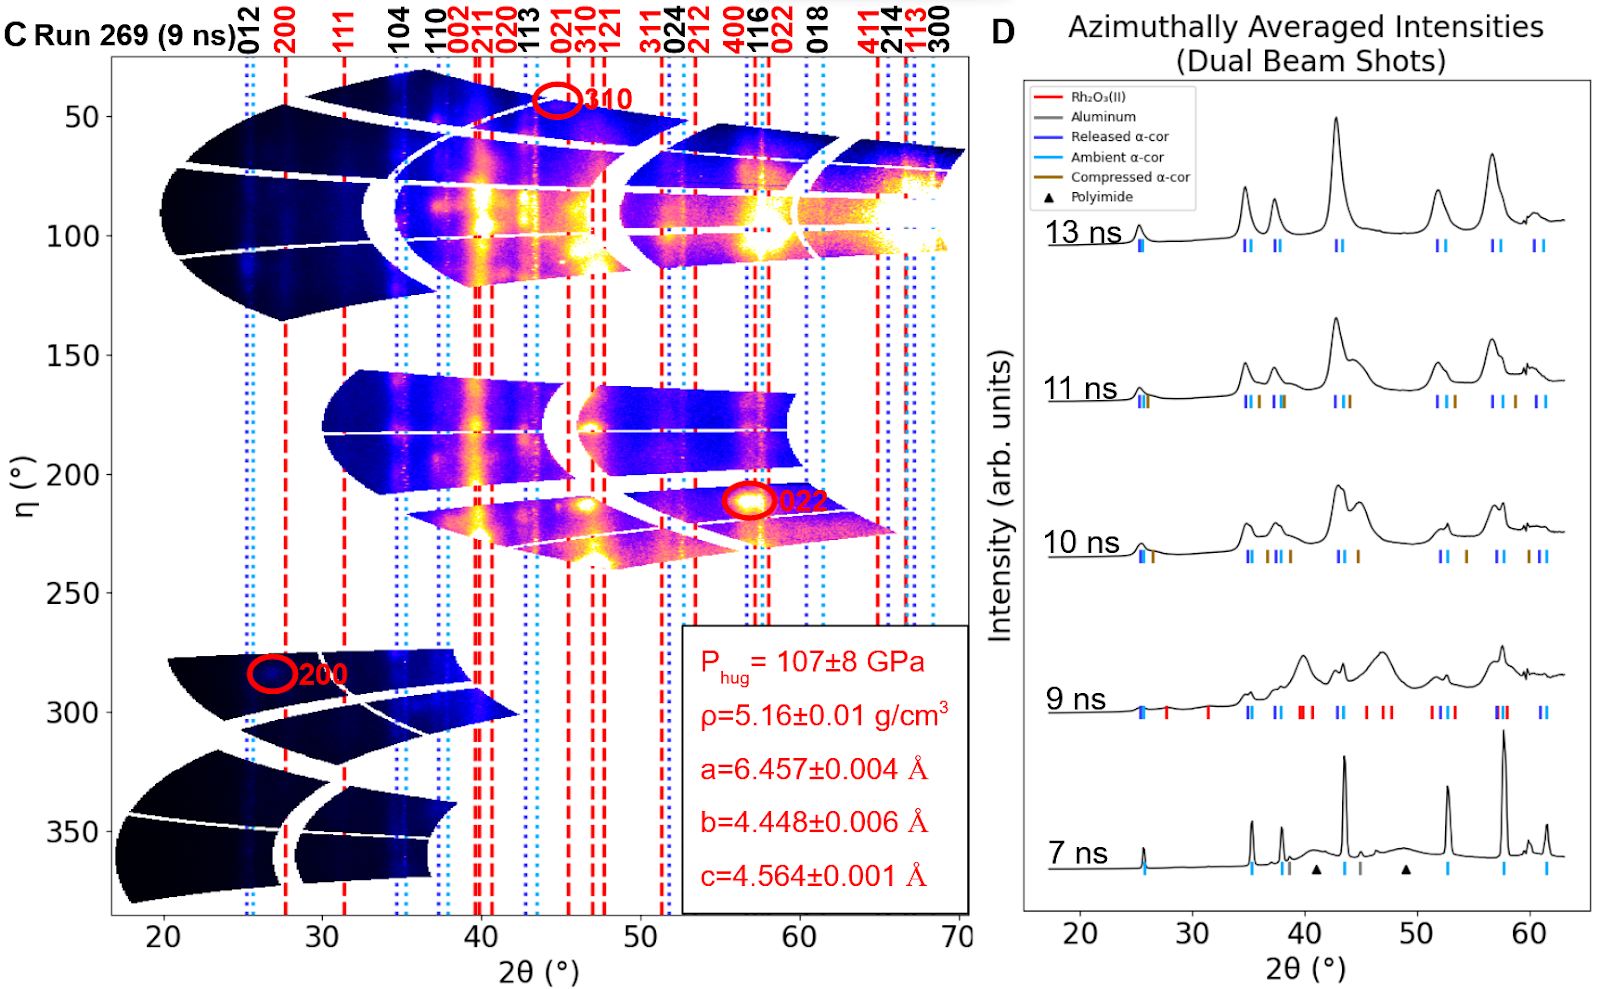
Fig. 3: X-ray diffraction patterns of shocked alumina. (A) Diffraction pattern of run 205, taken at 14 ns. Dashed vertical black and brown lines indicate peak positions of the starting material and shocked Al2O3 respectively. Miller indices of the diffracting planes are shown. An oversaturated color scale is used to highlight details in darker areas, as the intensity ratio between the brightest and darkest peaks is large. (B) Azimuthally averaged diffraction patterns of the single-beam shots. Lineouts are ordered by X-ray timing. Peaks that correspond to compressed (shocked or releasing) α-corundum are labeled with brown ticks, while diffraction peaks from the ambient starting material are labeled with blue ticks. Diffraction from the 1 µm-thick gold reflective coating is labeled with yellow ticks. Diffraction from the gold reflective coating is labeled with yellow ticks. Gold diffraction is not visible at 18 and 20 ns (runs 200 and 199). This may be due to melting during release from shock, as the pressure is lowered while temperature remains high. Based on the expected shock pressure, this would only happen if the gold undergoes a nonisentropic release and heats up during release. Alternatively, it is possible that the gold peaks are present but fully overlap with the Al2O3 (110) and (113) peaks. If this is the case, the corresponding density would be 22.94 g/cm3, consistent with gold during decompression (Briggs et al, 2019, p.045701). (C) Diffraction pattern of run 269, taken at 9 ns. Black and dark blue dotted lines indicate the calculated peak positions of α-corundum from the starting material and material released from shock, respectively. Dashed red lines indicate peak positions fit to the Rh2O3(II) structure. Peaks from the starting material and released material in the α-corundum phase show up in closely spaced pairs so only one label is provided for each pair. The red circles with Miller indices highlight spots of lower density Rh2O3(II) phase. As in (A), the data are not oversaturated, but an oversaturated color scale is used to highlight important details. (D) Diffraction patterns of the dual-beam shots. Peaks assigned to the Rh2O3(II) structure in the compressed state are labeled with red ticks, while those corresponding to α-corundum are labeled with blue, cyan and brown ticks depending on the compression state. Diffraction from the aluminum reflective coating is labeled with a gray tick. In the 7-ns profile, broad peaks at ~41° and ~48° are consistent with diffraction from the amorphous polyimide ablator (Katagiri et al, 2022, p.054103). See Fig. S1 in the Supplemental Materials for two-dimensional diffraction images from all runs.

Fig. 4: Pressure-density Hugoniot curve. Hugoniot data of single-crystal sapphire and polycrystalline alumina plotted in pressure-density spaces (Ahrens, Gust and Royce, 1968, pp.4610-4616; Barker and Hollenbach, 1970, pp.4208-4226; Erskine, 1993; Graham and Brooks, 1971, pp.2311-2330; Kleiser, Chhabildas and Reinhart, 2011, pp.473-479; Mashimo, Hanaoka and Nagayama, 1988, pp.327-336; Marsh, 1980; Reinhart, Chhabildas and Vogler, 2006, pp.655-669). Data from studies on c-cut sapphire are shown in black, a-cut in blue, m-cut in green, and polycrystalline alumina in red. The discontinuity in the Hugoniot indicates the Hugoniot elastic limit (HEL) of single crystal sapphire. The HEL of polycrystalline alumina is lower, but the deformational Hugoniot curve for alumina with no porosity has been found to be very similar to that of sapphire (Mashimo et al 2000, pp.2021-2024, Ahrens, Gust and Royce, 1968, pp.4610-4616). The deformational shock Hugoniot curve, shown in dark green, was obtained by linearly fitting the Hugoniot data above the HEL in Us-up space and using the Rankine-Hugoniot conservation equations to convert to pressure-density space. The dark green dashed lines indicate the error bounds of the fit. A 3% volume discontinuity associated with the α-corundum to Rh2O3(II) phase transition has been observed in static studies and continuum measurements, but was not taken into account in this fit (Lin et al, 2004, pp.389-393, Mashimo et al, 2000, pp.2021-2024). The blue asterisk indicates the pressure-density state of the starting material. Filled circles with error bars show the state measured during shock, which is constrained by the Hugoniot. Vertical dashed lines show the densities of the partially released states. Material that has released from compression with a two-beam drive laser and is near or at ambient pressure is labeled with a pink X.
4. Discussion
High Pressure Phase Transition
Our study provides direct evidence of a phase transition in alumina under shock compression at 107±8 GPa. This is consistent with static compression results and computational studies (Funamori and Jeanloz, 1997, pp.1109-1111; Lin et al, 2004, pp.389-393; Oganov and Ono, 2005, p.116; Thomson, Wentzcovitch and Bukowinski 1996, pp.1880-1882; Tsuchiya, Tsuchiya and Wentzcovitch, 2005, p.020103; Umemoto and Wentzcovitch, 2008, pp.6526-6530).
The diffraction patterns of the high-pressure phase fit both the Rh2O3(II) (Pbcn) and perovskite (Pbnm) structures. Given the known Hugoniot pressure-density relation, the densities calculated for both the Rh2O3(II) and perovskite structures (5.16±0.03 g/cm3) are consistent with the expected shock pressure of ~110 GPa. Due to the similarity in diffraction patterns between these two phases, it was difficult to differentiate between them, but results from computational free energy studies (Oganov and Ono, 2005, pp.10828-10831) show that the perovskite structure is not likely to be stable at the expected temperatures in our experiment (based on SESAME EOS #7410). Rietveld full-profile refinements on alumina at comparable P-T conditions in diamond cell experiments also support the stability of the Rh2O3(II) phase (Lin et al, 2004, pp.389-393)). These considerations lead us to believe that our shocked material most likely transformed to the Rh2O3(II) phase.
The Rh2O3(II) phase also yielded a slightly better fit, with a lower reduced χ2 than perovskite (Table 1). However, there is some ambiguity in hkl assignment where the peaks are highly textured and overlapping, so this distinction is not clear-cut.
Static compression experiments that report observation of the Rh2O3(II) phase find a wide mixed-phase region in which both α-corundum and Rh2O3(II) are observed (Funamori and Jeanloz, 1997, pp.1109-1111; Lin et al, 2004, pp.389-393). In our measurement at 107±8 GPa, we observe the high pressure orthorhombic structure with no trace of a shocked α-corundum phase. This may be due to the phase transition having a high kinetic barrier, leading to a slow transition and incomplete conversion to the high pressure phase in diamond anvil cell studies. With a uniaxial shock, non-hydrostaticity of the compression and the presence of shear stresses may make it easier to cross this barrier and fully convert to the new phase.
Temperature and Plastic Work
Dynamic release from the shock state is usually assumed to be a thermodynamically reversible process and hence isentropic. This assumption neglects possible irreversible heating associated with plastic deformation. The release rate in these experiments is so rapid (~ns) that the sample may retain dynamic strength during decompression. Such strength may result in substantial plastic-work heating and cause the release path to deviate markedly from the isentrope (Heighway et al, 2019, pp.532-535; Swift et al, 2007, p.054122). Our data on decompression from ~110 GPa enable us to place constraints on this heating to gauge the typical dynamic strength on unloading.
As illustrated in Fig. S5 and described in the Supplemental Material, in the X-ray images taken at 9, 10 and 11 ns we sample what is most likely laterally released material—shocked material that has equilibrated to the surrounding ambient material over time. We find that this material has a density lower even than that of unshocked material. This indicates that alumina has thermally expanded due to heating during the release.
The shock wave breaks out from alumina’s free rear surface between 11 and 13 ns, evidenced by a loss of peaks from the ambient unshocked material. After shock breakout, a backward-traveling release wave from the rear surface drops the normal stress σL to zero. At 13 ns, we observe only peaks from released material suggesting that by this time, the backward-traveling release wave has overlapped with the forward-traveling release wave from the alumina-kapton interface, which may draw the sample into tension (σL<0). Heating during release has been studied previously in metals (Heighway et al, 2019, pp.532-535), in which the interaction of release waves usually causes a sharp decrease in density far greater than that which could be caused by heating. However, in alumina, at 13 ns we actually measure a released density similar to those observed at earlier times. The lack of ellipticity in our diffraction rings indicates that the material does not experience significant tensile stress along the unloading axis. This suggests that the interaction of release waves causes material break-up rather than lattice expansion.
The temperature during dynamic release can be calculated from our measured densities and the known temperature-dependence of thermal expansivity of alumina (Fig. S2) (Watchman, Scuderi and Cleek, 1962, pp.319-323; Hahn, 1978, pp. 191-201; Schauer, 1964, pp.1857-1864; Amatuni and Shevchenko, 1976, pp.1256-1260; Yates, Cooper and Pojur, 1972, p.1046; Fitzer and Weisenburger, 1972, pp.25-35; Ebert and Tingwald, 1936, p.471; Mauer and Bolz, 1958; Campbell and Grain, 1961, pp.244-256; Kompan et al, 1999, pp.776-781; Kostanovskiy, et al, 2017, p.012317). At 9, 10 and 11 ns, our HYADES simulations suggest that the low-density signal we observe in our diffraction data can only be from laterally released material near the edge of the drive spot. If this material is under any nonzero, residual stress (due to the release being incomplete), we expect that stress to be positive. This means that the released material must be at least as hot as the zero-pressure thermal expansion data would have us believe; in two specimens of the same density, the one under greater pressure must have the greater temperature. Conversely, we expect that the later-time signal at 13 ns is from fully released material after the backward-facing release wave has overlapped with both front-facing and lateral waves. If there is any stress on the material due to the crossing of the release waves, we expect it to be tensile, although the lack of evidence for anisotropic strain suggests that this is likely not the case.
One confounding factor in interpreting these measurements is that there are small variations in laser pulse shape between runs, so the achieved shock pressure may vary (see Fig. S3). We are also sampling different portions of the material at different times; if there is any spatial variability in the stress state, different portions of the material may possess different strengths. Stronger material tends to release faster and release more heat, which may explain why our 9-ns run shows a higher nominal temperature than those taken at later times. More sophisticated simulations would be required to gain a better sense of the stress and temperature inhomogeneity throughout the sample.
In Fig. 5, we show both the Hugoniot and the isentropic release path emanating from the 107 GPa shock state in pressure-temperature space, calculated using a HYADES hydrodynamic simulation under SESAME EOS #7410. We predict that after being elevated to a temperature of around 1370 K by a 107 GPa shock, alumina would cool to 930 K were it to then release isentropically. However, based on our diffraction measurements of released material, we find that the post-release temperature is at least 1580 K, far higher than that predicted by isentropic release using the SESAME EOS (and, indeed, higher even than the shock temperature itself). We suggest the excess heat comes from plastic-work heating, in which heat is generated by frictional forces acting during shear plastic deformation. By solving for a simplified version of the heat equation, we can estimate the strength of alumina during dynamic release.
The equation governing the temperature evolution of an adiabatically released material is
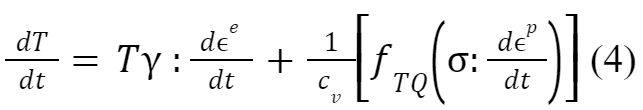
where e and p are the elastic and plastic strain tensors, respectively, is the Cauchy stress tensor, ɣ=V(∂σ/∂E)V is the Grüneisen tensor, cv is the volumetric heat capacity, and fTQ is the Taylor-Quinney factor. The former term represents the thermoelastic effect whereby reversible changes in density raise or lower the temperature of the material; this term is the origin of the isentropic cooling caused by release to ambient pressure in the absence of heating. The latter term represents plastic-work heating, which, in energetic terms, is simply the total plastic work rate σ:dϵp/dt multiplied by the phenomenological Taylor-Quinney factor fTQ, which expresses the fraction of plastic work dissipated as heat. The final release temperature is controlled by the relative magnitude of the above cooling and heating terms; the plastic-work heating is, in turn, controlled by the strength of alumina.
Using the heat equation to constrain the material strength accurately is extremely challenging for even the most intensively studied materials thanks to the unknown represented by the Taylor-Quinney factor. The fraction of plastic work converted to heat typically takes values between 0.70 and 0.95 in manufacturing forming processes (Taylor and Quinney, 1934, pp.307-326), but there is growing evidence that fTQ can take values beyond this range in extraordinary deformation scenarios: Taylor-Quinney factors of 0.5 or less were inferred in diamond undergoing ramp compression to 2 TPa (Lazicki et al, 2021, pp.532-535); meanwhile, values of fTQ greater than unity are possible during release, due to additional heating from defect annihilation processes (Heighway et al, 2019, p.245501). In view of this considerable uncertainty, we present an approximate solution to the heat equation that suffices to give an order-of-magnitude estimate of the strength. The equation (whose derivation is given in the Supplemental Materials) reads
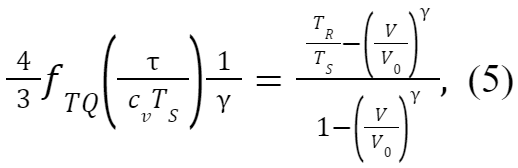
where is the conventional material strength (i.e. |σL-σT|/2, where σL and σT are the stresses along the loading and transverse directions, respectively), V/V0 is the compression ratio, and TR/TS is the ratio of the release temperature to the shock temperature. This equation allows us to gauge the magnitude of given alumina’s EOS, its shock and release temperatures, and its Taylor-Quinney factor.
To estimate ?, we took the volumetric heat capacity cv to be the classical value predicted by the Dulong-Petit law 3nkB. Given the paucity of data constraining the Taylor-Quinney factor in this regime, we further assumed that fTQ=1. With these assumptions, the heat equation yields a range from 5 GPa to above 9 GPa for the dynamic strength of alumina during release. The corresponding fitted release paths are shown in Fig. 5 for comparison with the isentropic release path. A dynamic strength of 5 GPa is in fact comparable to the strength of 5.2 GPa exhibited by alumina during compression to pressures just below the shock overdrive pressure (σL ~ 15 GPa), but exceeds the static strength of alumina in the steady shock state (around 2.5 GPa) (Bourne, 2007, p.073514). Our analysis demonstrates that the strength of dynamically releasing micron-scale alumina can easily reach the gigapascal level; stronger constraints upon the Taylor-Quinney factor in this regime would be needed to construct more accurate upper and lower limits on our strength estimate.
We should note that in addition to plastic work, a small amount of heat may be either supplied or absorbed by a phase transition from the Rh2O3(II)-type phase back to the α-corundum phase. A discontinuity in the actual isentrope at the phase transition could also contribute to higher temperatures. The SESAME EOS and our calculations do not account for the phase transition, which has been reported to have a -3% volume discontinuity (Lin et al, 2004, pp.389-393; Mashimo et al, 2000, pp.2021-2024). In the future, obtaining XRD patterns after full release in material shocked to below the phase transition would help to compare and quantify its effect on the release dynamics.
| Run # | X-ray timing | a (Å) | c (Å) | c/a | ⍴ (g/cm3) | T (K) |
| 269 | 9 ns | 4.835±0.001 | 13.201±0.006 | 2.730±0.002 | 3.801±0.003 | ≥2060 |
| 252 | 10 ns | 4.816±0.001 | 13.102±0.007 | 2.720±0.002 | 3.858±0.004 | ≥1580 |
| 270 | 11 ns | 4.811±0.001 | 13.151±0.004 | 2.734±0.001 | 3.853±0.002 | ≥1630 |
| 273 | 13 ns | 4.817±0.001 | 13.174±0.005 | 2.735±0.002 | 3.837±0.003 | ≤1770 |
| Ambient | – | 4.757 | 12.993 | 2.731 | 3.989 | 300 |
Table 4: Nominal temperature calculated from density after release from ~110 GPa shock (dual-beam drive). This calculation suggests a rough lower bound of 1580 K on the release temperature.

Fig. 5: Deviation from isentropic release in dual-beam runs. After release from shock, temperatures calculated from density are much higher than that predicted by isentropic release. The magenta triangles indicate nominal temperatures from the released ɑ-corundum in our dual beam runs. The black dashed line shows our lower bound estimate of the release path, while the region in blue shows a range of possible release paths, for which we do not have a solid upper bound. This calculation assumes the dynamic strength remains constant throughout release.
5. Conclusions
In this study, we present the first in situ measurements of crystal structure in shock compressed alumina. We find that alumina shocked to 107±8 GPa produces X-ray diffraction patterns consistent with the Rh2O3(II) phase, in agreement with the results of static and computational studies. This could potentially allow for the characterization of additional phase transformations in alumina at higher pressures that cannot be reached with static compression techniques, such as the proposed transition from the post-perovskite structure (Cmcm) to a U2S3-type structure (Pmcn) phase transition that has been predicted to take place at ~370 GPa (Umemoto & Wentzcovitch, 2008, pp.6526-6530). We also utilize a relatively new method to estimate material strength from X-ray diffraction, and show its first application in an ionic solid.
Acknowledgments
We thank Carol A. Davis for help in assembling the alumina targets. We are grateful to Connor Krill and Tyler Perez for their assistance in running hydrocode simulations. This work was performed under the auspices of the U.S. Department of Energy (DOE) by Lawrence Livermore National Laboratory under LLNL’s Laboratory Directed Research and Development (LDRD) Program under Grant Nos. 18-ERD-001, 18-ERD-012, and 21-ERD-032. Lawrence Livermore National Laboratory is operated by Lawrence Livermore National Security, LLC, for the U.S. Department of Energy, National Nuclear Security Administration under Contract No. DE-AC52-07NA27344. Use of the Linac Coherent Light Source (LCLS), SLAC National Accelerator Laboratory, is supported by the US Department of Energy, Office of Science, Office of Basic Energy Sciences under contract number DE-AC02-76SF00515. The MEC instrument is supported by the US Department of Energy, Office of Science, Office of Fusion Energy Sciences under contract number SF00515.
References
Ahrens, T.J., Gust, W.H. and Royce, E.B., 1968. Material strength effect in the shock compression of alumina. Journal of Applied Physics, 39(10), pp.4610-4616.
Amatuni, A.N. and Shevchenko, E.B., 1966. Linear thermal expansion of monocrystalline quartz and aluminum oxide. Measurement Techniques, 9(10), pp.1256-1260.
Bancroft, D., Peterson, E.L. and Minshall, S., 1956. Polymorphism of iron at high pressure. Journal of Applied Physics, 27(3), pp.291-298.
Barker, L.M. and Hollenbach, R.E., 1970. Shock-wave studies of PMMA, fused silica, and sapphire. Journal of Applied Physics, 41(10), pp.4208-4226.
Bourne, N.K., Millett, J.C.F., Chen, M., McCauley, J.W. and Dandekar, D.P., 2007. On the Hugoniot elastic limit in polycrystalline alumina. Journal of Applied Physics, 102(7), p.073514.
Boyce, D.E. and Bernier, J.V., 2013. hexrd: Modular, open source software for the analysis of high energy x-ray diffraction data (No. LLNL-SR-609815). Lawrence Livermore National Lab.(LLNL), Livermore, CA (United States).
Briggs, R., Coppari, F., Gorman, M.G., Smith, R.F., Tracy, S.J., Coleman, A.L., Fernandez-Pañella, A., Millot, M., Eggert, J.H. and Fratanduono, D.E., 2019. Measurement of body-centered cubic gold and melting under shock compression. Physical Review Letters, 123(4), p.045701.
Brown, S.B., Hashim, A., Gleason, A., Galtier, E., Nam, I., Xing, Z., Fry, A., MacKinnon, A., Nagler, B., Granados, E. and Lee, H.J., 2017. Shock drive capabilities of a 30-Joule laser at the matter in extreme conditions hutch of the Linac Coherent Light Source. Review of Scientific Instruments, 88(10), p.105113.
Campbell, W.J. and Grain, C., 1961. Thermal expansion of alpha-alumina. Advances in X-ray analysis, 5, pp.244-256.
Doremus, R.H., 2008. Alumina. In Ceramic and Glass Materials (pp. 1-26). Springer, Boston, MA.
Duan, W., Karki, B.B. and Wentzcovitch, R.M., 1999. High-pressure elasticity of alumina studied by first principles. American mineralogist, 84(11-12), pp.1961-1966.
Duffy, T.S. and Smith, R.F., 2019. Ultra-high pressure dynamic compression of geological materials. Frontiers in Earth Science, 7, p.23.
Ebert, H. and Tingwald, C., 1936. Zeitschrift für Physik, 37, p.471
Erskine, D., 1993. High pressure hugoniot of sapphire: shock wave of condensed matter.
Fitzer, E. and Weisenburger, S., 1972, January. Cooperative measurement of the thermal expansion behavior of different materials up to 1000 C by pushrod dilatometers. In AIP Conference Proceedings (Vol. 3, No. 1, pp. 25-35). American Institute of Physics.
Funamori, N. and Jeanloz, R., 1997. High-pressure transformation of Al2O3. Science, 278(5340), pp.1109-1111.
Glenzer, S.H., Fletcher, L.B., Galtier, E., Nagler, B., Alonso-Mori, R., Barbrel, B., Brown, S.B., Chapman, D.A., Chen, Z., Curry, C.B. and Fiuza, F., 2016. Matter under extreme conditions experiments at the Linac Coherent Light Source. Journal of Physics B: Atomic, Molecular and Optical Physics, 49(9), p.092001.
Graham, R.A. and Brooks, W.P., 1971. Shock-wave compression of sapphire from 15 to 420 kbar. The effects of large anisotropic compressions. Journal of Physics and Chemistry of Solids, 32(10), pp.2311-2330.
Hahn, T.A., 1978. Thermal expansion of single crystal sapphire from 293 to 2000 K Standard reference material 732. In Thermal Expansion 6 (pp. 191-201). Springer, Boston, MA.
Heighway, P.G., Sliwa, M., McGonegle, D., Wehrenberg, C., Bolme, C.A., Eggert, J., Higginbotham, A., Lazicki, A., Lee, H.J., Nagler, B. and Park, H.S., 2019. Nonisentropic release of a shocked solid. Physical Review Letters, 123(24), p.245501.
Herrmann, S., Boutet, S., Duda, B., Fritz, D., Haller, G., Hart, P., Herbst, R., Kenney, C., Lemke, H., Messerschmidt, M. and Pines, J., 2013. CSPAD-140k: A versatile detector for LCLS experiments. Nuclear Instruments and Methods in Physics Research Section A: Accelerators, Spectrometers, Detectors and Associated Equipment, 718, pp.550-553.
Irifune, T., 1994. Absence of an aluminous phase in the upper part of the Earth’s lower mantle. Nature, 370(6485), pp.131-133.
Jephcoat, A.P., Hemley, R.J. and Mao, H.K., 1988. X-ray diffraction of ruby (Al2O3: Cr3+) to 175 GPa. Physica B+ C, 150(1-2), pp.115-121.
Katagiri, K., Ozaki, N., Murayama, D., Nonaka, K., Hironaka, Y., Inubushi, Y., Miyanishi, K., Nakamura, H., Okuchi, T., Sano, T. and Seto, Y., 2022. Hugoniot equation-of-state and structure of laser-shocked polyimide C 22 H 10 N 2 O 5. Physical Review B, 105(5), p.054103.
Kleiser, G.J., Chhabildas, L.C. and Reinhart, W.D., 2011. Comparison of dynamic compression behavior of single crystal sapphire to polycrystalline alumina. International journal of impact engineering, 38(6), pp.473-479.
Kompan, T.A., Korenev, A.S., Lukin, A.Y., Antonov, P.I., Krymov, V.M. and Moskalev, A.V., 1999. Standard measures of thermal expansion made of monocrystalline aluminum oxide for a broad range of temperatures. Measurement Techniques, 42(8), pp.776-781.
Kostanovskiy, A., Kostanovskaya, M., Zeodinov, M. and Pronkin, A., 2017, October. Investigation of the thermal expansion of the refractory materials at high temperatures. In Journal of Physics: Conference Series (Vol. 891, No. 1, p. 012317). IOP Publishing.
Langenhorst, F. and Deutsch, A., 2012. Shock metamorphism of minerals. Elements, 8(1), pp.31-36.
Larsen, J.T. and Lane, S.M., 1994. HYADES—A plasma hydrodynamics code for dense plasma studies. Journal of Quantitative Spectroscopy and Radiative Transfer, 51(1-2), pp.179-186.
Lazicki, A., McGonegle, D., Rygg, J.R., Braun, D.G., Swift, D.C., Gorman, M.G., Smith, R.F., Heighway, P.G., Higginbotham, A., Suggit, M.J. and Fratanduono, D.E., 2021. Metastability of diamond ramp-compressed to 2 terapascals. Nature, 589(7843), pp.532-535.
Lin, J.F., Degtyareva, O., Prewitt, C.T., Dera, P., Sata, N., Gregoryanz, E., Mao, H.K. and Hemley, R.J., 2004. Crystal structure of a high-pressure/high-temperature phase of alumina by in situ X-ray diffraction. Nature materials, 3(6), pp.389-393.
Lyon, S.P., 1992. Sesame: the Los Alamos National Laboratory equation of state database. Los Alamos National Laboratory report LA-UR-92-3407.
Mao, H.K., Bell, P.M., Shaner, J.T. and Steinberg, D.J., 1978. Specific volume measurements of Cu, Mo, Pd, and Ag and calibration of the ruby R 1 fluorescence pressure gauge from 0.06 to 1 Mbar. Journal of applied physics, 49(6), pp.3276-3283.
Marsh, S.P. ed., 1980. LASL shock Hugoniot data. University of California press.
Mashimo, T., Hanaoka, Y. and Nagayama, K., 1988. Elastoplastic properties under shock compression of Al2O3 single crystal and polycrystal. Journal of applied physics, 63(2), pp.327-336.
Mashimo, T., Tsumoto, K., Nakamura, K., Noguchi, Y., Fukuoka, K. and Syono, Y., 2000. High‐pressure phase transformation of corundum (α‐Al2O3) observed under shock compression. Geophysical research letters, 27(14), pp.2021-2024.
Mauer, F. and Bolz, L., 1958, WADC Technical Report ASTIA Document No. 155555, pp.55-473.
McBride, E.E., Krygier, A., Ehnes, A., Galtier, E., Harmand, M., Konôpková, Z., Lee, H.J., Liermann, H.P., Nagler, B., Pelka, A. and Rödel, M., 2019. Phase transition lowering in dynamically compressed silicon. Nature Physics, 15(1), pp.89-94.
Oganov, A.R. and Ono, S., 2005. The high-pressure phase of alumina and implications for Earth’s D ″layer. Proceedings of the National Academy of Sciences, 102(31), pp.10828-10831.
Pavlovskii, M.N. and Drakin, V.P., 1966. Concerning the metallic phase of carbon. Soviet Journal of Experimental and Theoretical Physics Letters, 4, p.116.
Reinhart, W.D., Chhabildas, L.C. and Vogler, T.J., 2006. Investigating phase transitions and strength in single-crystal sapphire using shock–reshock loading techniques. International journal of impact engineering, 33(1-12), pp.655-669.
Schauer, A., 1964. Thermal expansion of solids and the temperature dependence of lattice vibration frequencies. Canadian Journal of Physics, 42(10), pp.1857-1864.
Shen, G. and Lazor, P., 1995. Measurement of melting temperatures of some minerals under lower mantle pressures. Journal of Geophysical Research: Solid Earth, 100(B9), pp.17699-17713.
Swift, D.C., Seifter, A., Holtkamp, D.B. and Clark, D.A., 2007. Shock and release temperatures in molybdenum: Experiment and theory. Physical Review B, 76(5), p.054122.
Swift, D.C., Kraus, R.G., Loomis, E.N., Hicks, D.G., McNaney, J.M. and Johnson, R.P., 2008. Shock formation and the ideal shape of ramp compression waves. Physical Review E, 78(6), p.066115.
Taylor, G.I. and Quinney, H., 1934. The latent energy remaining in a metal after cold working. Proceedings of the Royal Society of London. Series A, Containing Papers of a Mathematical and Physical Character, 143(849), pp.307-326.
Thomson, K.T., Wentzcovitch, R.M. and Bukowinski, M.S., 1996. Polymorphs of alumina predicted by first principles: Putting pressure on the ruby pressure scale. Science, 274(5294), pp.1880-1882.
Tsuchiya, J., Tsuchiya, T. and Wentzcovitch, R.M., 2005. Transition from the Rh2O3 (II)-to-CaIrO3 structure and the high-pressure-temperature phase diagram of alumina. Physical Review B, 72(2), p.020103.
Turneaure, S.J. and Gupta, Y.M., 2011. Material strength determination in the shock compressed state using X-ray diffraction measurements. Journal of Applied Physics, 109(12), p.123510.
Umemoto, K. and Wentzcovitch, R.M., 2008. Prediction of an U2S3-type polymorph of Al2O3 at 3.7 Mbar. Proceedings of the National Academy of Sciences, 105(18), pp.6526-6530.
Wicks, J.K., Smith, R.F., Fratanduono, D.E., Coppari, F., Kraus, R.G., Newman, M.G., Rygg, J.R., Eggert, J.H. and Duffy, T.S., 2018. Crystal structure and equation of state of Fe-Si alloys at super-Earth core conditions. Science advances, 4(4), p.eaao5864.
Wachtman Jr, J.B., Scuderi, T.G. and Cleek, G.W., 1962. Linear thermal expansion of aluminum oxide and thorium oxide from 100 to 1100 K. Journal of the American Ceramic Society, 45(7), pp.319-323.
Wojdyr, M., 2010. Fityk: a general‐purpose peak fitting program. Journal of applied crystallography, 43(5‐1), pp.1126-1128.
Yates, B., Cooper, R.F. and Pojur, A.F., 1972. Thermal expansion at elevated temperatures. II. Aluminium oxide: Experimental data between 100 and 800 K and their analysis. Journal of Physics C: Solid State Physics, 5(10), p.1046.