The lab focuses on constructing quantitative models of biological nervous systems based on their neurophysiology, neuroanatomy, and on the organism’s behavior. We focus on understanding neuronal function at the systems level, reflecting the interaction of subsystems to generate useful behavior. Modeling is particularly important for understanding this and other systems-level functions since it requires the interaction of several pathways and neural functions. Below are listed some of the areas the lab is working on.
Selective Attention
One of the functions studied is selective attention, which is the capability of higher animals to scan sensory input for the most important information and to discard all others. The lab constructs models of the neuronal basis of visual selective attention by simulating them on digital computers and comparing the results with data obtained from primates’ visual and somatosensory systems. Particular attention is paid to the mechanisms involving the implementation of neural mechanisms that make use of the temporal structure of neuronal firing, rather than just the average firing rate.
Perceptual Organization
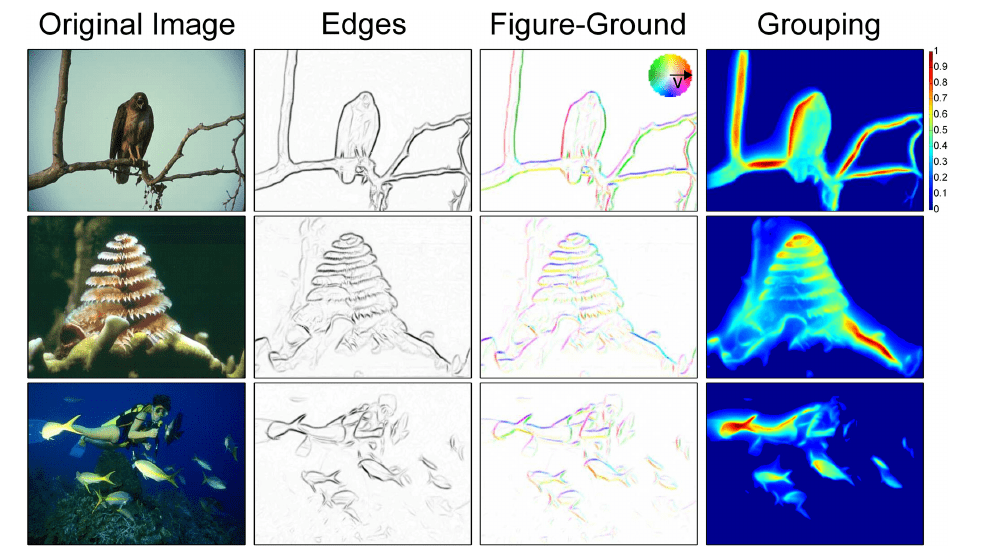
Everything we see starts as photons impinging on photoreceptors in the retina which transforms this raw physical signal into a format useful to the brain (including compression of up to 100:1 under certain light conditions). The signal sent to the brain is transmitted over the optic nerve which in the human has about 1 million axons. This is a representation of the visual input akin to a picture of 1 million pixels per eye. While all visual information we can ever perceive is coded in this representation, the amount of information available (approx 100 Megabits/sec per eye) is much more than can be processed in detail. This representation in terms of ’pixels’ is not particularly suitable for us to function efficiently in our complex environment. Therefore, the brain re-organizes the input it receives from the retina from ’pixels’ into entities we call ’objects,’ like faces, houses, trees, etc which are used during perception. This process is called ’perceptual organization’ and we study how this change of representation is implemented in the brain. This is closely related to attention (see the previous section) since obviously the task of selective attention (the process of choosing what is important) can be much easier done on a relatively small set of objects rather than on a million “pixels.” The selection can then be made between the objects present in the visual field at any given time, and which are known to behave in accordance with physical laws. For instance, objects typically move with continuity through space and time), interact in ways that we are familiar with etc, while no such constraints exist for a million independent ’pixels’.
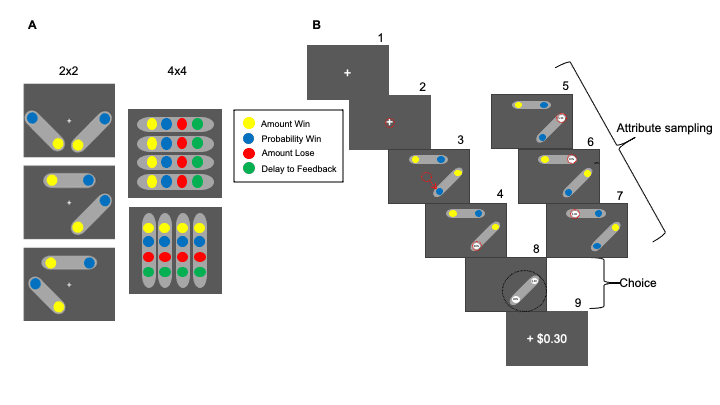
Decision Making
The third major research topic in the lab is to understand how we make decisions. Assume you go grocery shopping and you end up in a very small store that only has 100 different products for sale. You want to fill your shopping basket with a collection of items from what is offered in the store. Standard economic theory assumes that you look at all possible combinations of available items and pick the one that best fits your requirements. But in practice, that is impossible to do: From basic combinatorics, the number of combinations you can form from 100 items is more than (100/50 ) ≈10^30 (a one followed by 30 zeroes). If it would take you only one second to compare the relative quality of each of the potential combinations you could choose with that all other combinations, it would take you a thousand trillion years to go through all of them! And now imagine doing this not in a shop with 100 items but when you go shopping at your local supermarket: a standard American supermarket carries 40,000 products! Clearly, comparing all possible choices is not what we do. Instead, we make a selection of the most promising possibilities and only evaluate and compare those. The problem is thus again similar to that of selective attention where we have an overwhelming amount of information and we have to choose the most relevant parts of it. In our research we apply what we have learned from modeling attentional selection in perception to understanding the process of selecting among different choices when making a decision.